Once in a while you have to debug your web project on a phone. But sometimes there is no device available and you have to use a simulator. Or there might be another situation, where you see a bug on your phone while testing and cannot understand which element has broken off or which style has gone wild.
The best tool for the job would be the browser’s inspector, but how does one spin it up on a mobile device? Using chrome://inspect sure thing!
Usage
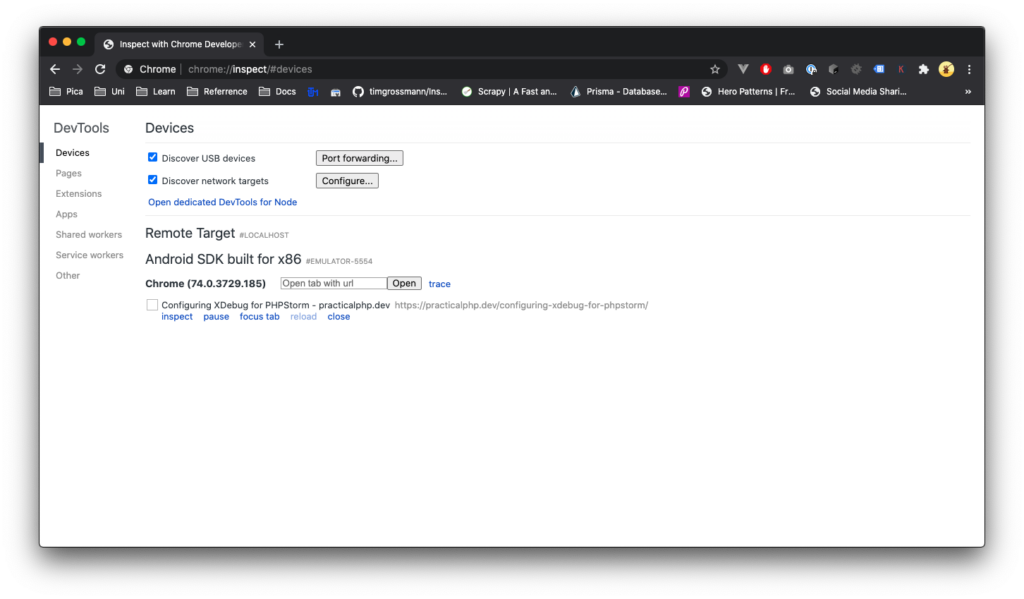
On accessing chrome://inspect, I’m greeted with a screen showcasing my local devices. In case I create a virtual machine, connect via USB or wireless network, a target devices gets added to the list. If chrome or google web view exists on the device, the instance is displayed within the page. It enables us to use some cool features, such as inspecting, pausing and reloading the particular page, without even touching the device.

chrome://inspect page
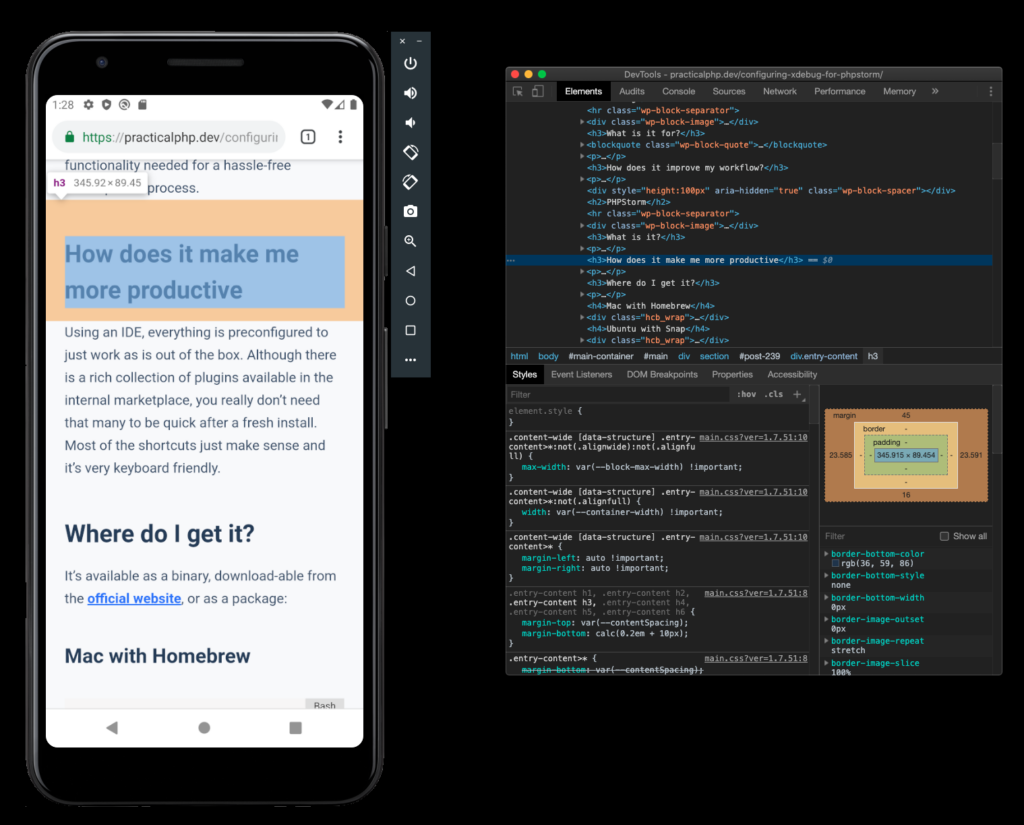
IMHO the most useful feature for a web developer is inspection, because it allows us to see some usually unreacheable parts of the website for a regular mobile user. To do that, simply click on inspect and a new window will popup with all the familiar tools.

Inspect demo
References
In case you are not familiar with the concept of inspection, or have never really understood that class of tooling, please explore: https://developers.google.com/web/tools/chrome-devtools. It greatly improves development productivity and helps identify and eradicate a wide range of bugs and problems.
Conclusion
There we have it. This little trick has immensely helped me while developing a web view application for a project that I’ve been working on. A piece of styling had a big usability flaw, replicable only on mobile devices. By using this method I was able to quickly and effectively get rid of the problem and move on with my day 😉
Thanks for reading!
If you have a suggestion, please feel free to let me know below or on any social media!


